Exploring data on COVID-19
In this post, We will cover the basic syntax of julia language, and explore the data related on COVID-19. This is the summary of lecture "Introduction to Computational Thinking with Julia, with applications to modeling the COVID-19 Pandemic" from MIT.


Why Julia?
- Julia: Developed at MIT by Prof. Alan Edelman's group
- Released in 2012.
-
Current release: 1.4
-
Free, open source software
- developed by world-wide community on Github
- Over 3000 registered packages in wide range of domains
Julia
- Modern, powerful language
- Interactive but high performance (fast) - previously mutually exclusive
- Syntax: similar to Python / Matlab / R
- But carefully designed for high-performance computational science & engineering applications
- Design means that most of Julia is written in Julia itself
- Hence much easier to examine and modify algorithms
url = "https://raw.githubusercontent.com/CSSEGISandData/COVID-19/master/csse_covid_19_data/csse_covid_19_time_series/time_series_covid19_confirmed_global.csv"
url
typeof(url)
*
(1 + 2im) * (3 + im)
@which (1+ 2im) * (3 + im)
download(url, "covid_data.csv")
readdir
readdir()
using Pkg   # built-in package manager in Julia: Pkg
Pkg.add("CSV")   # calls the `add` function from the module Pkg.  This installs a package
Pkg.add("DataFrames")
using CSV, DataFrames
CSV.read("./covid_data.csv", DataFrame)
data = CSV.read("covid_data.csv", DataFrame)
data
typeof(data)
We can rename each column name.
data_2 = rename(data, 1 => "province", 2 => "country")
data_2
rename!(data, 1 => "province", 2 => "country")
data
?rename
Pkg.add("Interact")
using Interact
for i in 1:10
    @show i
end
typeof(1:10)
collect(1:10)
for i in 1:10
    println("i = ", i)
end
countries = data[2:5, 2]
countries = data[1:end, 2]
countries = collect(data[:, 2])
unique_countries = unique(countries)
Note: Julia has 1-based indexing: indices of vectors start at 1, not 0
startswith("United", "U")
startswith("David", "U")
Array comprehension:
U_countries = [startswith(country, "U") for country in countries]
data[U_countries, :]
countries .== "US"
US_row = findfirst(countries .== "US")
data[US_row, :]
UC_data_row = data[US_row, :]
US_data = convert(Vector, UC_data_row[5:end])
Pkg.add("Plots")
using Plots
plot(US_data)
col_names = names(data)
date_strings = String.(names(data))[5:end]
Parse: convert string representation into a Julia object
date_strings[1]
using Dates
format = Dates.DateFormat("d/m/Y")
parse(Date, date_strings[1], format)
format = Dates.DateFormat("m/d/Y")
parse(Date, date_strings[1], format) + Year(2000)
dates = parse.(Date, date_strings, format) + Year(2000)
plot(dates, US_data, xticks=dates[1:5:end], xrotation=45, leg=:topleft,
    label="US data", m=:o)

xlabel!("date")
ylabel!("confirmed cases in US")
title!("US confirmed COVID-19 cases")
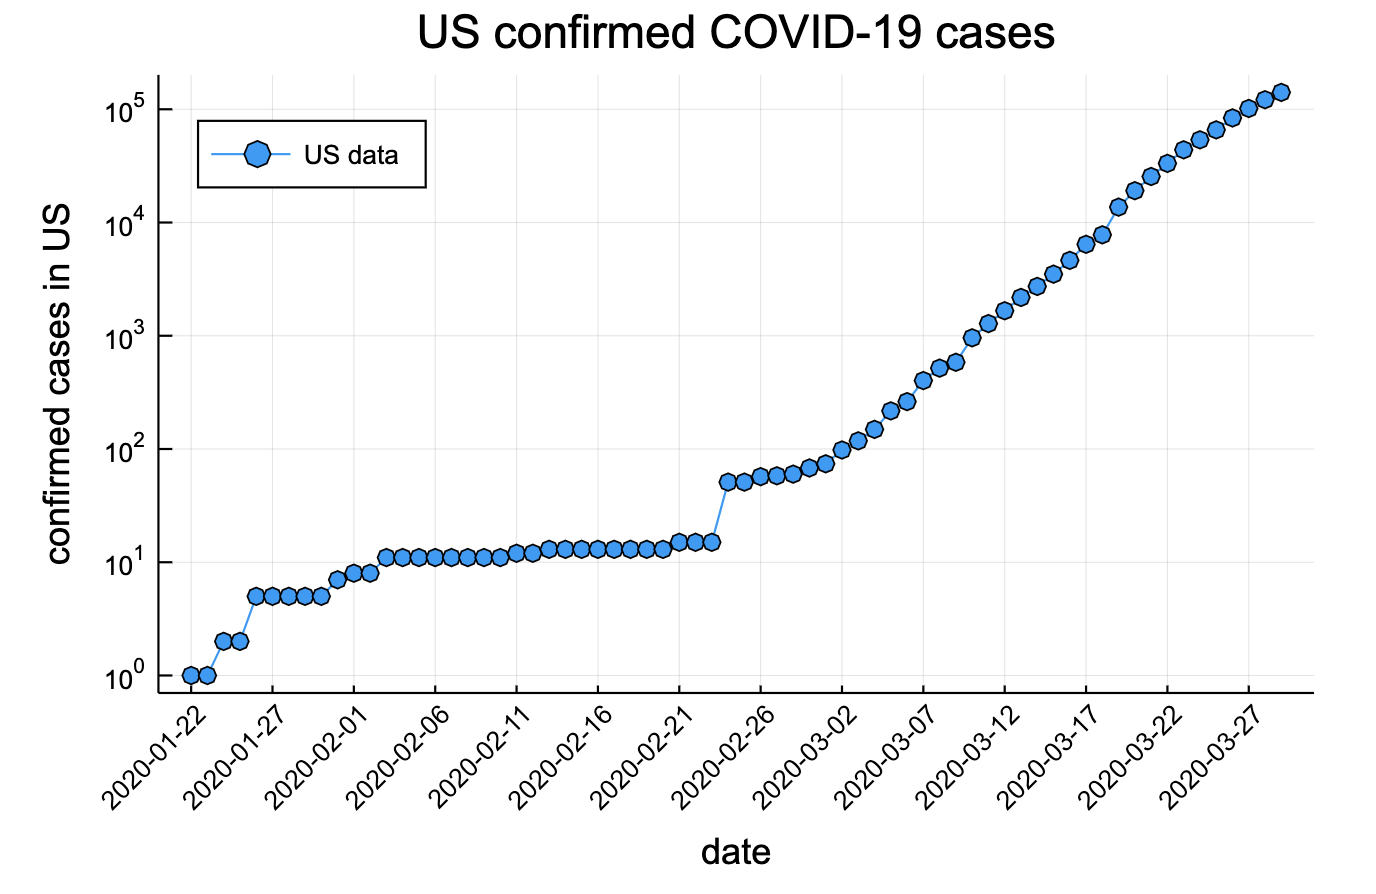
plot(dates, US_data, xticks=dates[1:5:end], xrotation=45, leg=:topleft,
    label="US data", m=:o,
    yscale=:log10)

xlabel!("date")
ylabel!("confirmed cases in US")
title!("US confirmed COVID-19 cases")