Cross Validation
Holdout sets are a great start to model validation. However, using a single train and test set if often not enough. Cross-validation is considered the gold standard when it comes to validating model performance and is almost always used when tuning model hyper-parameters. This chapter focuses on performing cross-validation to validate model performance. This is the Summary of lecture "Model Validation in Python", via datacamp.


- The problems with holdout sets
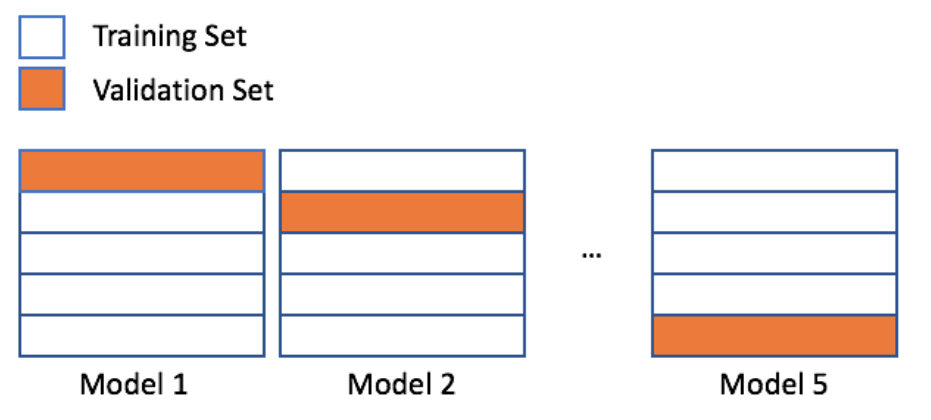
- Cross-validation
- sklearn's cross_val_score()
- Leave-one-out-cross-validation (LOOCV)
import pandas as pd
import numpy as np
import matplotlib.pyplot as plt

plt.rcParams['figure.figsize'] = (8, 8)
Two samples
After building several classification models based on the tic_tac_toe dataset, you realize that some models do not generalize as well as others. You have created training and testing splits just as you have been taught, so you are curious why your validation process is not working.
After trying a different training, test split, you noticed differing accuracies for your machine learning model. Before getting too frustrated with the varying results, you have decided to see what else could be going on.
tic_tac_toe = pd.read_csv('./dataset/tic-tac-toe.csv')
tic_tac_toe.head()
sample1 = tic_tac_toe.sample(n=200, random_state=1111)
sample2 = tic_tac_toe.sample(n=200, random_state=1171)

# Print the number of common observations
print(len([index for index in sample1.index if index in sample2.index]))

# Print the number of observations in the Class column for both samples
print(sample1['Class'].value_counts())
print(sample2['Class'].value_counts())
Notice that there are a varying number of positive observations for both sample test sets. Sometimes creating a single test holdout sample is not enough to achieve the high levels of model validation you want. You need to use something more robust.
scikit-learn's KFold()
You just finished running a colleagues code that creates a random forest model and calculates an out-of-sample accuracy. You noticed that your colleague's code did not have a random state, and the errors you found were completely different than the errors your colleague reported.
To get a better estimate for how accurate this random forest model will be on new data, you have decided to generate some indices to use for KFold cross-validation.
candy = pd.read_csv('./dataset/candy-data.csv')
candy.head()
X = candy.drop(['competitorname', 'winpercent'], axis=1).to_numpy()
y = candy['winpercent'].to_numpy()
from sklearn.model_selection import KFold

# Use KFold
kf = KFold(n_splits=5, shuffle=True, random_state=1111)

# Create splits
splits = kf.split(X)

# Print the number of indices
for train_index, val_index in splits:
    print("Number of training indices: %s" % len(train_index))
    print("Number of validation indices: %s" % len(val_index))
This dataset has 85 rows. You have created five splits - each containing 68 training and 17 validation indices. You can use these indices to complete 5-fold cross-validation.
Using KFold indices
You have already created splits, which contains indices for the candy-data dataset to complete 5-fold cross-validation. To get a better estimate for how well a colleague's random forest model will perform on a new data, you want to run this model on the five different training and validation indices you just created.
In this exercise, you will use these indices to check the accuracy of this model using the five different splits. A for loop has been provided to assist with this process.
splits = kf.split(X)
from sklearn.ensemble import RandomForestRegressor
from sklearn.metrics import mean_squared_error

rfc = RandomForestRegressor(n_estimators=25, random_state=1111)

# Access the training and validation indices of splits
for train_index, val_index in splits:
    # Setup the training and validation data
    X_train, y_train = X[train_index], y[train_index]
    X_val, y_val = X[val_index], y[val_index]

    # Fit the random forest model
    rfc.fit(X_train, y_train)

    # Make predictions, and print the accuracy
    predictions = rfc.predict(X_val)
    print("Split accuracy: " + str(mean_squared_error(y_val, predictions)))
KFold() is a great method for accessing individual indices when completing cross-validation. One drawback is needing a for loop to work through the indices though.
scikit-learn's methods
You have decided to build a regression model to predict the number of new employees your company will successfully hire next month. You open up a new Python script to get started, but you quickly realize that sklearn has a lot of different modules. Let's make sure you understand the names of the modules, the methods, and which module contains which method.
Follow the instructions below to load in all of the necessary methods for completing cross-validation using sklearn. You will use modules:
- metrics
- model_selection
- ensemble
from sklearn.model_selection import cross_val_score
from sklearn.ensemble import RandomForestRegressor
from sklearn.metrics import mean_squared_error, make_scorer
Implement cross_val_score()
Your company has created several new candies to sell, but they are not sure if they should release all five of them. To predict the popularity of these new candies, you have been asked to build a regression model using the candy dataset. Remember that the response value is a head-to-head win-percentage against other candies.
Before you begin trying different regression models, you have decided to run cross-validation on a simple random forest model to get a baseline error to compare with any future results.
rfc = RandomForestRegressor(n_estimators=25, random_state=1111)
mse = make_scorer(mean_squared_error)

# Setup cross_val_score
cv = cross_val_score(estimator=rfc, X=X_train, y=y_train, cv=10, scoring=mse)

# Print the mean error
print(cv.mean())
You now have a baseline score to build on. If you decide to build additional models or try new techniques, you should try to get an error lower than 155.56. Lower errors indicate that your popularity predictions are improving.
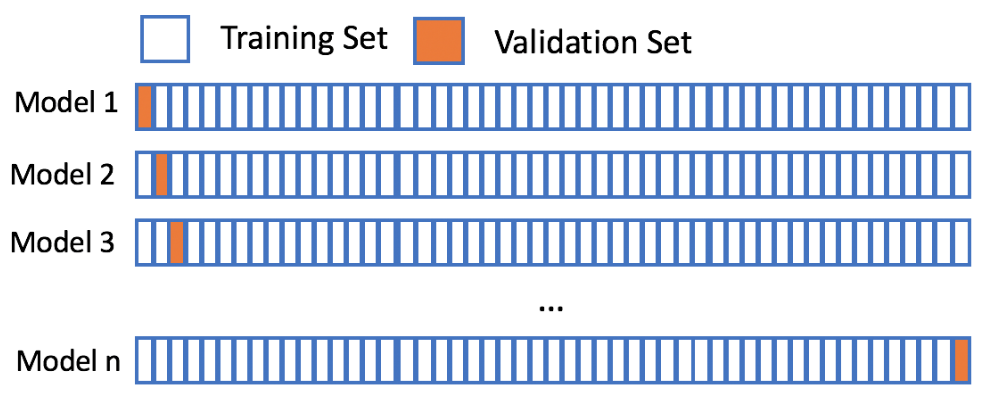
Leave-one-out-cross-validation
Let's assume your favorite candy is not in the candy dataset, and that you are interested in the popularity of this candy. Using 5-fold cross-validation will train on only 80% of the data at a time. The candy dataset only has 85 rows though, and leaving out 20% of the data could hinder our model. However, using leave-one-out-cross-validation allows us to make the most out of our limited dataset and will give you the best estimate for your favorite candy's popularity!
from sklearn.metrics import mean_absolute_error
# Create scorer
mae_scorer = make_scorer(mean_absolute_error)

rfr = RandomForestRegressor(n_estimators=15, random_state=1111)

# Implement LOOCV
scores = cross_val_score(rfr, X, y, cv=85, scoring=mae_scorer)

# Print the mean and standard deviation
print("The mean of the errors is: %s." % np.mean(scores))
print("The standard deviation of the errors is: %s." % np.std(scores))
You have come along way with model validation techniques. The final chapter will wrap up model validation by discussing how to select the best model and give an introduction to parameter tuning.